

The CSS Solved General Science & Ability (GSA) Past Paper 2026 is Solved by Pakistan’s top GSA Coaches, Miss Iqra Ali and Sir Ammar Hashmi. They are the only coaches available in Pakistan who have solved the last 20 years’ GSA solved papers to help aspirants know how to attempt the paper to score above 80. And they have guided thousands of CSS and PMS aspirants. Both coaches have been known for their teaching methodology and imparting concepts to their students, who scored the highest marks in this subject. At the special request of CSSPrepForum, both coaches have solved the paper.

PART-II
SECTION-I
Question No. 2
(A) Evaluating the Impact of Excessive Fertilizer Use on Soil Chemistry and Groundwater Quality?
Question Breakdown:
The question evaluates the effects of excessive fertilizer use on soil chemistry, including nutrient imbalance and chemical degradation, and examines how fertilizer leaching contaminates groundwater. It also requires assessing the environmental and health consequences of groundwater pollution and the need for sustainable fertilizer management practices.
Answer:
Excessive fertilizer use refers to the application of nutrients beyond crop requirements or at inappropriate times and methods. Factors contributing to overuse include lack of soil testing, subsidized fertilizer policies, limited farmer awareness, and pressure to maximize yields. Such practices disrupt nutrient cycling and increase nutrient losses through leaching, runoff, and volatilization.
Impacts on Soil and Water
- Soil Acidification and Cation Exchange
Excessive use of ammonium-based fertilizers lowers soil pH through nitrification, releasing hydrogen ions. Recent data (2025) shows an average drop of 1.5 pH units in intensively farmed regions. This acidity reduces nutrient availability, mobilizes toxic aluminum, and creates a cycle of over-fertilization that can ultimately lead to permanent soil degradation.
- Depletion of Microbial Dynamics
Moreover, excessive chemical fertilizers act as biocides, suppressing beneficial soil microbes like Rhizobia and Mycorrhizal fungi. Studies show a 25% decline in microbial biomass in high NPK fields. Without these organisms, organic matter decomposition slows, leading to soil compaction, reduced water retention, and a brittle soil that requires constant artificial inputs to remain productive.
- Heavy Metal Accumulation
Furthermore, synthetic phosphate fertilizers often contain trace heavy metals from phosphate rock, which accumulate in topsoil over decades. For example, cadmium levels in some agricultural soils exceed WHO limits by 15%. These metals bioaccumulate in crops and enter the human food chain, posing long-term risks to kidney and neurological health.
- Nitrate Leaching and Health Risks
Groundwater is contaminated by leaching nitrates, which are highly mobile and seep into deep aquifers. While the WHO limit is 50 mg/L, 2026 samples show levels up to 120 mg/L in agricultural regions. This causes Methemoglobinemia (Blue Baby Syndrome) and poses a serious public health risk linked to fertilizer runoff.
- Salinity and Electrical Conductivity
Fertilizer salts cause secondary salinization, raising groundwater EC and making water unusable. Saline water harms crop and can permanently turn fertile land into salt-affected soil.
- Eutrophication of Aquifers
Fertilizer runoff into surface water causes eutrophication, triggering massive algal blooms. In 2025, 80% of water bodies near intensive farms were eutrophic. Decomposing algae depletes oxygen, creating dead zones and destroying aquatic life.
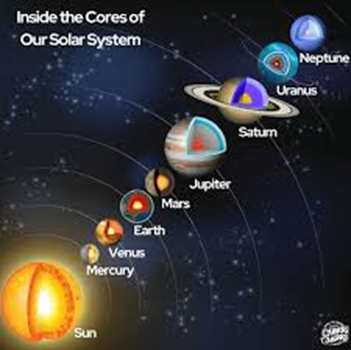
(B) Describe the structural organization of solar system, including terrestrial planets, gas giants, and dwarf planets.
Question Breakdown:
The question requires explaining the overall structure of the solar system and describing the classification and key characteristics of terrestrial planets, gas giants, and dwarf planets within this arrangement.
Answer:
The Solar System is a gravitationally bound system formed 4.6 billion years ago from the solar nebula. It is organized around the Sun, with terrestrial planets, gas giants, ice giants, dwarf planets, moons, asteroids, and comets following a structured pattern based on distance, composition, and gravitational influence.
Overall Structure of the Solar System
The Sun occupies nearly 99.8 percent of the total mass of the Solar System, making it the dominant gravitational force. All planets revolve around the Sun in elliptical orbits lying roughly in the same plane called the ecliptic. The planets are arranged in concentric zones, with rocky planets closer to the Sun and gaseous bodies farther away.
Sun → Mercury → Venus → Earth → Mars → Asteroid Belt
→ Jupiter → Saturn → Uranus → Neptune → Kuiper Belt
Terrestrial (Inner) Planets
The terrestrial planets are the four innermost planets: Mercury, Venus, Earth, and Mars. They are characterized by solid, rocky surfaces, high density, and relatively small size. These planets are composed mainly of silicate rocks and metals, particularly iron and nickel.
- Mercury is the closest planet to the Sun and has extreme temperature variations due to its thin atmosphere.
- Venus, similar in size to Earth, has a thick carbon dioxide atmosphere causing an intense greenhouse effect.
- Earth is unique for its liquid water, oxygen-rich atmosphere, and ability to support life.
- Mars, known as the Red Planet, has surface features such as volcanoes and valleys, indicating past water activity.
- Asteroid Belt
Between Mars and Jupiter lies the asteroid belt, consisting of millions of rocky and metallic objects. These are remnants of early solar system material that never formed into a planet due to Jupiter’s strong gravitational influence. The largest asteroid, Ceres, is also classified as a dwarf planet.
Gas Giants and Ice Giants (Outer Planets)
- Gas Giants
Jupiter and Saturn are known as gas giants. They are massive planets composed primarily of hydrogen and helium, with no definite solid surface.
- Jupiter is the largest planet and has a powerful magnetic field and the Great Red Spot, a giant storm.
- Saturn is famous for its extensive ring system made of ice and rock particles.
Their strong gravity helps stabilize the Solar System by deflecting comets and asteroids.
- Ice Giants
Uranus and Neptune are classified as ice giants due to their composition of water, ammonia, and methane ices.
- Uranus has a unique axial tilt, causing extreme seasonal variations.
- Neptune is known for its strong winds and deep blue color.
These planets are colder and less massive than gas giants but still significantly larger than terrestrial planets.
Dwarf Planets
Dwarf planets are celestial bodies that orbit the Sun and are nearly spherical but have not cleared their orbital neighborhood. The International Astronomical Union recognizes several dwarf planets.
Key examples include
- Pluto, located in the Kuiper Belt, once considered the ninth planet.
- Ceres, found in the asteroid belt.
- Eris, a distant object even larger than Pluto.
Diagram of dwarf planet region
Kuiper Belt → Pluto, Eris, Haumea, Makemake
Small size – Icy composition – Irregular orbits
Dwarf planets play an important role in understanding the formation and evolution of the Solar System.
Kuiper Belt and Oort Cloud
Beyond Neptune lies the Kuiper Belt, a disk-shaped region filled with icy bodies and dwarf planets. Farther still is the Oort Cloud, a hypothetical spherical shell surrounding the Solar System and believed to be the source of long-period comets.Bottom of Form
(C) Discuss the environmental and comical challenges associated with polymer degradation. evaluate the effectiveness of biodegradable plastics in addressing global plastic pollution.
Question Breakdown:
The question requires discussing the environmental and chemical challenges involved in polymer degradation, including persistence, toxic by-products, and microplastic formation. It also demands an evaluation of how effective biodegradable plastics are in mitigating global plastic pollution, considering their limitations, real-world degradation conditions, and overall environmental impact.
Answer:
Synthetic plastics are indispensable due to their durability and low cost; however, these same qualities make them persistent environmental pollutants. As conventional polymers accumulate in ecosystems, biodegradable plastics are promoted as a solution, though their real effectiveness in addressing global plastic pollution remains debatable.
Chemical and Environmental Challenges
- Photo-oxidation and Microplastics
The main chemical challenge is photo-oxidative degradation, where UV rays break polymers into microplastics. By 2026, 90% of table salt samples contain microplastics. These fragments persist in oceans, absorb pollutants, and alter marine sediment chemistry while entering the food chain.
- Leaching of Toxic Additives
Moreover, degrading plastics release chemical additives like Phthalates and Bisphenol A (BPA). In 2025, degrading PVC in waterways increased endocrine disruptor levels by 400%. These chemicals leach into the environment, disrupting aquatic hormonal systems and causing reproductive failures and biodiversity loss.
- Soil Health and Microbial Disruption
In soils, nano plastics from degrading mulch films reduce porosity and microbial activity. By 2026, earthworm biomass declined by 20% in plastic-saturated soils. Hydrophobic particles disrupt water distribution and root growth, gradually turning fertile land into sterile, plastic-choked soil.
Effectiveness of Biodegradables
- The Promise of PHAs and PLA
Biodegradable plastics like Polyhydroxyalkanoates (PHA) can be metabolized by bacteria into CO₂ and water. PHA degrades up to 90% in marine environments within six months, avoiding microplastic formation. When properly managed, it offers a viable route to zero-waste in agriculture and packaging.
- The Industrial Composting Limitation
A key limitation of biodegradable plastics is their conditional nature. Polylactic Acid (PLA) requires industrial composting above 58°C, yet 60% of consumers discard it in regular bins. In landfills, it persists for decades or produces methane, making biodegradability ineffective without proper waste management.
- Land Use and Ecotoxicity Trade-offs
Bioplastic production creates a “food vs. plastic” land conflict. Replacing 20% of global plastics would need millions of hectares, and 2025 studies show a 15% rise in eutrophication from fertilizer runoff. Thus, while biodegradable plastics reduce litter, they may increase chemical pollution in water systems.
(D) Identify the major causes of food deterioration (biological, chemical, physical). give examples of each.
Question Breakdown:
The question requires identifying the three major causes of food deterioration, biological, chemical, and physical, and explaining each category with relevant examples to illustrate how they affect food quality and safety.
Answer:
Food deterioration refers to the undesirable changes in food quality that make it unacceptable or unsafe for consumption. These changes may affect taste, texture, color, nutritional value, and safety. Food deterioration occurs due to biological, chemical, and physical factors, often acting simultaneously. Understanding these causes is essential for effective food preservation and public health protection.
Biological Causes of Food Deterioration
Biological deterioration is caused by living organisms that utilize food as a source of nutrients. It is the most common cause of food spoilage.
a. Microorganisms
Bacteria, fungi, and yeasts are primary agents of food spoilage. They grow rapidly in moist, warm, and nutrient-rich foods.
Examples
- Bacteria spoil milk by producing lactic acid, causing souring.
- Molds grow on bread and fruits, producing visible fuzzy growth.
- Yeasts ferment sugars in fruit juices, causing off-flavors and gas formation.
Some microorganisms also produce toxins, making food dangerous even if it appears normal.
b. Enzymatic Activity
Natural enzymes present in foods continue to function after harvesting or slaughter, leading to deterioration.
Examples
- Browning of apples and bananas due to enzymatic oxidation.
- Softening fruits as enzymes break down cell walls during ripening.
- Autolysis in fish causing texture degradation after death.
c. Insects and Rodents
Pests cause both physical damage and microbial contamination.
Examples
- Insects infesting stored grains.
- Rodents contaminate food with droppings and urine.
Chemical Causes of Food Deterioration
Chemical reactions within food or with environmental substances lead to quality loss and spoilage.
a. Oxidation
Oxidation occurs when food components react with oxygen, leading to rancidity and nutrient loss.
Examples
- Rancidity in fats and oils producing unpleasant odors.
- Loss of vitamin C in exposed fruit juices.
- Discoloration of cut fruits due to oxidation.
b. Hydrolysis
Hydrolysis involves the breakdown of food components by water.
Examples
- Fat hydrolysis in butter produces free fatty acids.
- Texture changes in starchy foods during improper storage.
c. Non-Enzymatic Browning
This occurs due to chemical reactions between sugars and amino acids.
Examples
- Maillard reaction in stored milk powder causing browning.
- Darkening of dried fruits during long storage.
Physical Causes of Food Deterioration
Physical factors cause damage without altering chemical composition but still reduce food quality.
a. Temperature Extremes
High or low temperatures accelerate spoilage.
Examples
- Freezer burns in frozen meat due to moisture loss.
- Spoilage of cooked food left at room temperature.
b. Moisture Changes
Improper moisture levels promote microbial growth or texture damage.
Examples
- Caking powdered foods in humid conditions.
- Wilting vegetables due to moisture loss.
c. Mechanical Damage
Handling and transportation can physically damage food.
Examples
- Bruising fruits during transport.
- Cracking eggs leading to microbial entry.

Question No. 3
(A) Explain the key phases of disaster risk management, mitigation, preparedness, responses and recovery.
Question Breakdown:
The question requires explaining the key phases of disaster risk management, mitigation, preparedness, response, and recovery, by outlining their objectives and roles in reducing disaster impacts and ensuring effective post-disaster rehabilitation.
Answer:
Disaster Risk Management (DRM) is a systematic approach to reducing disaster risks and minimizing their impacts on life, property, and the environment. It addresses both natural and human-induced hazards through four interconnected phases: mitigation, preparedness, response, and recovery, forming a continuous cycle for resilience and sustainable development.
1. Mitigation
Mitigation involves long-term measures taken before a disaster occurs to reduce or eliminate the severity of its impact. The primary objective of mitigation is to minimize vulnerability and exposure to hazards.
Key Measures
- Structural measures such as construction of dams, flood embankments, earthquake-resistant buildings, and cyclone shelters
- Non-structural measures including land-use planning, hazard zoning, environmental protection, and enforcement of building codes
- Public awareness campaigns and risk assessments
Examples
- Construction of levees to reduce flood damage
- Seismic building codes in earthquake-prone areas
- Mangrove plantation along coastlines to reduce tsunami and storm surge impacts
Mitigation is the most cost-effective phase, as investment made before disasters significantly reduces losses afterward. In 2025, Japan’s investment in seismic retrofitting resulted in a 30% reduction in potential structural damage during tremors. By implementing zoning laws that prevent construction in floodplains, mitigation aims to ensure that a hazard never becomes a disaster.
2. Preparedness
Preparedness refers to activities undertaken in advance of a disaster to ensure effective response when a disaster occurs. It focuses on developing the capacity of individuals, communities, and institutions to cope with disasters.
Key Measures
- Disaster preparedness plans and early warning systems
- Training of emergency responders and volunteers
- Mock drills, evacuation planning, and stockpiling of emergency supplies
- Public education on emergency procedures
Examples
- Cyclone early warning systems in coastal regions
- Emergency evacuation drills in schools and hospitals
- Pre-positioning of food, water, and medical supplies
Preparedness reduces panic, saves lives, and enables a faster and more organized response. The 2026 Global Risk Report highlights that countries with functional community-based early warning systems (EWS) have 60% lower mortality rates during cyclones. This phase ensures that operational readiness is maintained through training and resource allocation, bridging the gap between a predicted event and the actual arrival of a hazard.
3. Response
Response includes immediate actions taken during and immediately after a disaster to save lives, reduce suffering, and prevent further damage. This phase focuses on emergency assistance and relief operations.
Key Measures
- Search and rescue operations
- Emergency medical care and first aid
- Provision of food, water, shelter, and sanitation
- Restoration of essential services such as electricity and communication
Examples
- Rescue of trapped individuals after an earthquake
- Setting up temporary shelters for flood-affected populations
- Emergency medical camps for disaster victims
Response activities are time-critical and require effective coordination among government agencies, armed forces, NGOs, and local communities. For instance, during the 2025 Mediterranean floods, the use of AI-driven drones for Search and Rescue (SAR) increased victim location speed by 40%. This “Golden Hour” requires coordinated logistics and rapid mobilization of emergency services. It is the most visible phase of DRM, where the effectiveness of the preceding preparedness phase is put to the ultimate test.
4. Recovery
Recovery involves restoring and improving livelihoods, infrastructure, and living conditions after the immediate emergency phase has ended. It aims not only to rebuild but also to reduce future disaster risks.
Key Measures
- Reconstruction of homes, schools, hospitals, and roads
- Economic rehabilitation and livelihood support
- Psychological counseling and social rehabilitation
- Incorporation of disaster-resilient designs in rebuilding
Examples
- Rebuilding houses with flood-resistant designs
- Financial assistance to farmers after droughts
- Rehabilitation of displaced communities
Recovery is a long-term process and provides an opportunity to “build back better” by integrating mitigation measures into development planning.
(B) Describe the physical factors that trigger avalanches in mountainous regions. Name the modern technologies used in avalanche prediction and monitoring.
Question Breakdown:
The question requires describing the physical factors that trigger avalanches in mountainous regions, such as snowpack instability, slope angle, and weather conditions, and identifying modern technologies used for avalanche prediction and monitoring, including remote sensing, radar, and GIS-based early warning systems.
Answer:
An avalanche is the rapid downslope movement of snow under gravity, commonly occurring in high-altitude mountainous regions. Avalanches are primarily triggered by physical factors related to terrain, snowpack conditions, and weather. Advances in technology have significantly improved avalanche prediction and monitoring, helping reduce associated risks.
Physical Factors Triggering Avalanches
1. Slope Angle and Terrain
Avalanches typically occur on slopes between 30° and 45°, where gravitational force exceeds snow cohesion. Convex slopes, gullies, and smooth ground surfaces increase instability.
2. Snowpack Structure
Weak layers within the snowpack, such as loosely bonded snow beneath dense slabs, are a major cause of slab avalanches. Poor bonding between layers increases failure risk.
3. Snowfall and Wind Action
Heavy snowfall adds sudden weight to the snowpack, while wind redistributes snow to form unstable wind slabs on leeward slopes.
4. Temperature Variations
Rapid warming weakens snow bonds through melting, while freeze–thaw cycles alter snow structure, increasing avalanche probability.
Modern Technologies Used in Avalanche Prediction and Monitoring
1. Remote Sensing and Satellite Imaging
Satellite-based remote sensing provides large-scale monitoring of snow cover, temperature, and terrain conditions. High-resolution imagery helps identify avalanche-prone slopes and track changes in snow accumulation over time.
2. Automated Weather Stations
Weather stations installed in mountainous regions continuously record temperature, wind speed, snowfall, and humidity. Real-time meteorological data is essential for assessing snowpack stability and forecasting avalanche risk.
3. Snowpack Stability Sensors
Modern sensors measure snow depth, density, and temperature gradients within the snowpack. These instruments help detect weak layers and monitor changes that may lead to avalanche initiation.
4. Ground-Based Radar and LiDAR
Radar and LiDAR systems are used to detect snow movement and measure terrain features with high precision. These technologies help identify unstable snow masses and assess slope geometry critical for avalanche prediction.
5. Geographic Information Systems (GIS)
GIS integrates terrain data, snowpack information, weather conditions, and historical avalanche records to create hazard maps. These maps support decision-making for land-use planning and disaster risk reduction.
6. Artificial Intelligence and Computer Models
Advanced computer models and artificial intelligence analyze large datasets to simulate snow behavior and predict avalanche occurrence. These models enhance early warning systems and improve forecasting accuracy.
(C) Discuss the structural diversity of lipids. Evaluate how variations of fatty acids composition influence membrane fluidity and cell signaling mechanisms.
Question Breakdown:
The question requires discussing the structural diversity of lipids and evaluating how variations in fatty acid composition affect membrane fluidity and influence cellular processes such as signaling and molecular transport.
Answer:
Lipids are a diverse group of biomolecules essential for energy storage, membrane structure, and cellular signaling. Their structural diversity arises from variations in fatty acid chains and functional groups. Changes in fatty acid composition significantly influence membrane fluidity and regulate cell signaling mechanisms.
Structural Diversity of Lipids
Lipids exhibit wide structural diversity based on their chemical composition and biological functions.
- Simple lipids include triglycerides, composed of glycerol and three fatty acids, mainly serving as energy reserves.
- Complex lipids, such as phospholipids and glycolipids, contain additional functional groups and form the structural framework of cell membranes.
- Derived lipids, including steroids and eicosanoids, are involved in hormone synthesis and signaling.
This diversity allows lipids to perform structural, metabolic, and regulatory roles in cells.
Influence of Fatty Acid Composition on Membrane Fluidity
Fatty acids vary in chain length and degree of saturation, which directly affect membrane properties.
- Saturated fatty acids have straight chains that pack tightly, decreasing membrane fluidity.
- Unsaturated fatty acids, especially those with cis double bonds, introduce kinks that prevent tight packing, increasing membrane fluidity.
- Shorter fatty acid chains enhance fluidity, while longer chains reduce it.
Membrane fluidity is essential for proper functioning of membrane proteins, transport processes, and cellular adaptability to temperature changes.
Role in Cell Signaling Mechanisms
Variations in lipid composition also regulate cell signaling.
- Certain fatty acids act as precursors of signaling molecules, such as prostaglandins derived from arachidonic acid.
- Membrane fluidity influences receptor mobility and signal transduction, affecting how cells respond to external stimuli.
- Lipid microdomains, known as lipid rafts, concentrate signaling proteins and regulate pathways involved in immune response and cell growth.
Thus, lipid structure directly controls both signal initiation and transmission.
(D) Describe the process of solar photovoltaic energy conversion. How do factors such as irradiance, panel orientation, and temperature influence solar power output?
Question Breakdown:
The question requires describing the process of solar photovoltaic energy conversion, explaining how sunlight is transformed into electrical energy, and analyzing how factors like irradiance, panel orientation, and temperature affect solar power output and efficiency.
Answer:
Solar photovoltaic (PV) energy conversion is the process of converting sunlight directly into electricity using semiconductor materials. It is a clean, renewable, and increasingly cost-effective source of energy, widely used in residential, commercial, and industrial applications.
Process of Solar Photovoltaic Energy Conversion
- Photon Absorption: Solar cells, typically made of silicon, absorb sunlight (photons). The energy from photons excites electrons in the semiconductor, creating electron-hole pairs.
- Electron Movement: Built-in electric fields in the PV cell direct electrons toward the conductive layer, generating electric current.
- Electricity Generation: Electrons flow through an external circuit, producing direct current (DC) electricity, which can be converted to alternating current (AC) using inverters.
- System Components: A PV system includes solar panels, inverters, charge controllers, and sometimes batteries for energy storage.
Factors Affecting Solar Power Output
- Solar Irradiance
The amount of sunlight reaching a PV panel determines electricity generation. Higher irradiance produces more electron-hole pairs, increasing current, while cloudy or low-light conditions reduce output.
- Panel Orientation and Tilt
Panels generate maximum power when sunlight strikes perpendicularly. Correct azimuth and tilt angles, adjusted to latitude, ensure optimal energy capture throughout the year.
- Temperature
High temperatures reduce voltage and efficiency in solar cells. Panels perform best at moderate temperatures, with efficiency dropping by about 0.5% per degree above 25°C.
- Shading and Surface Conditions
Partial shading or dust on the panel reduces sunlight absorption and current flow. Keeping panels clean and free from shadows is essential for optimal performance.
Question No. 4
(A) Describe the principles of hydroelectric power generation. What environmental and geographical constraints limit the widespread development of hydropower?
Question Breakdown:
The question requires describing the principles of hydroelectric power generation, including energy conversion from flowing water to electricity, and analyzing the environmental and geographical constraints that limit the widespread development of hydropower.
Answer:
Hydroelectric power (hydropower) is a renewable energy source that converts the potential energy of water stored at height into electricity. It is a clean and reliable source of energy, contributing significantly to the electricity supply in many countries. The generation of hydropower relies on the principles of water flow, gravity, and energy conversion.
Principles of Hydroelectric Power Generation
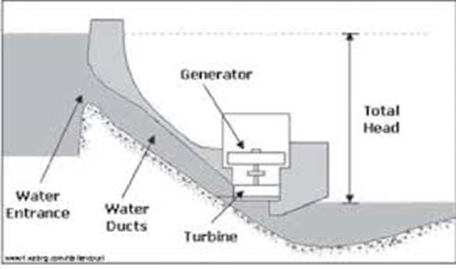
Hydroelectric power generation is based on the conversion of potential energy of water into mechanical energy and then into electrical energy. Water stored in a dam or reservoir at height possesses potential energy. When released, water flows through penstocks, driving the turbines. The turbines rotate the generators, converting mechanical energy into electrical energy. The power output depends on the flow rate of water and the height (head) of the water source.

Environmental Constraints
Hydropower projects can have significant environmental impacts:
- Ecosystem Disruption: Dams alter river flow, affect fish migration, and flood terrestrial habitats, leading to biodiversity loss.
- Water Quality: Stagnant reservoir water can lead to eutrophication, reduced oxygen levels, and accumulation of sediments.
- Greenhouse Gas Emissions: Decomposition of submerged organic matter releases methane and carbon dioxide, particularly in tropical regions.
- Social Impact: Large dams may displace communities and submerge agricultural lands.
Geographical Constraints
Hydropower development is limited by specific geographical and hydrological conditions:
- Availability of Water: Consistent River flow is necessary; arid or seasonal rivers are unsuitable.
- Topography: Steep slopes and high elevation differences are ideal; flat terrains provide insufficient water head.
- Seismic Risk: Earthquake-prone areas pose structural risks to dams.
- Remote Locations: Many hydro sites are far from demand centers, increasing transmission costs.
These constraints restrict large-scale hydropower development to regions with suitable topography, stable water flow, and minimal environmental or social disruption.
(B) Describe the hydrosphere and major components of earth’s water. How does the water cycle maintain the distribution of freshwater?
Question Breakdown:
The question requires describing the hydrosphere and its major components, including oceans, glaciers, groundwater, and surface water, and explaining how the water cycle maintains the distribution and renewal of freshwater on Earth.
Answer:
The hydrosphere encompasses all water on, under, and above the Earth’s surface. It is essential for sustaining life, regulating climate, and supporting ecosystems. Earth’s water exists in various reservoirs and constantly circulates through the water cycle, maintaining the availability and distribution of freshwater.
Major Components of Earth’s Water
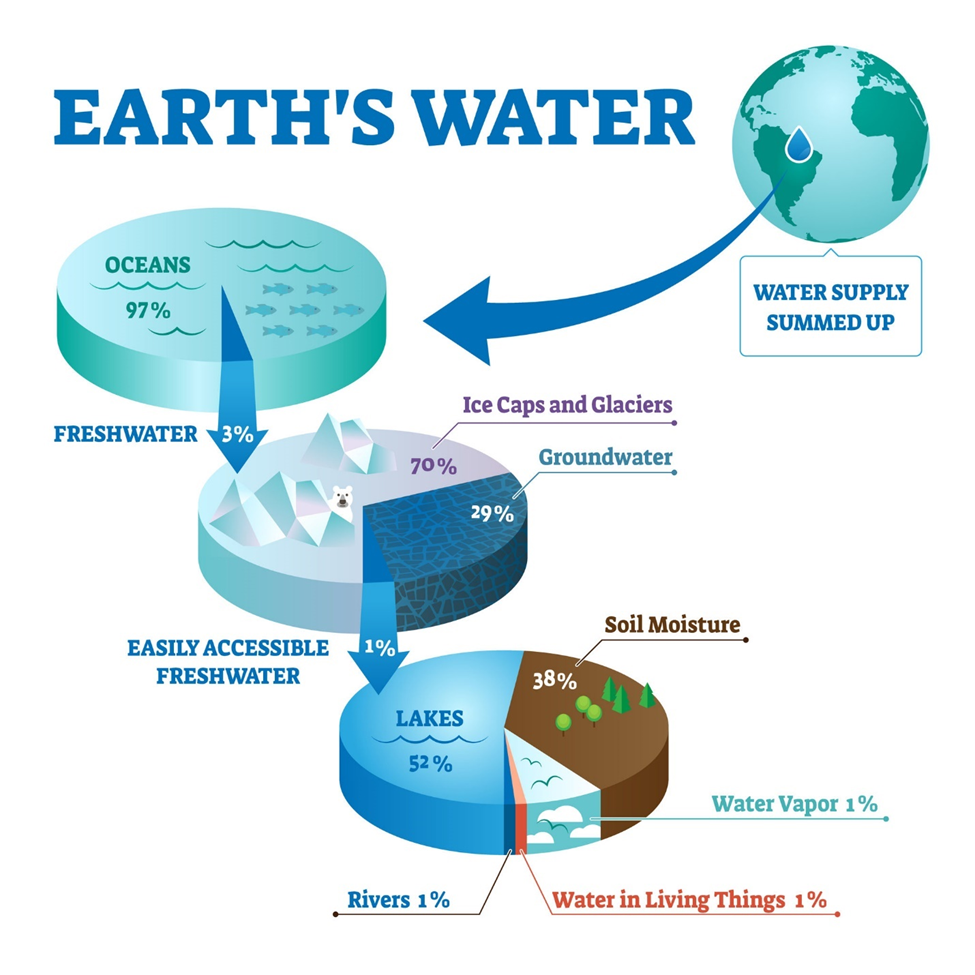
Earth’s water can be broadly categorized into saltwater and freshwater.
Oceans and Seas
Oceans hold about 97% of the Earth’s water, mostly saline, forming the largest component of the hydrosphere.
Freshwater
- Glaciers and Ice Caps: About 2% of global water, mostly stored in polar regions.
- Groundwater: Approximately 0.6%, stored in aquifers and underground reservoirs.
- Surface Water: Rivers, lakes, and reservoirs contain less than 0.01% of freshwater but are critical for human use.
- Atmospheric Water: Water vapor and clouds form a small but dynamic fraction, supporting precipitation.
Water Cycle and Freshwater Distribution
The water cycle (hydrologic cycle) continuously moves water between the atmosphere, oceans, land, and living organisms. Key processes include evaporation, condensation, precipitation, infiltration, and runoff.
- Evaporation: Solar energy converts surface water into vapor.
- Condensation: Water vapor forms clouds and atmospheric moisture.
- Precipitation: Rain, snow, or hail returns water to the surface, replenishing rivers, lakes, and groundwater.
- Infiltration and Runoff: Water seeps into soil to recharge aquifers or flows into streams and oceans.
This cycle maintains the balance and distribution of freshwater, ensures replenishment of surface and underground reservoirs, and sustains ecosystems and human needs.
(C) Explain the causative agent, mode of transmission, and life cycle of the dengue virus. How does the Aedes mosquito contribute to the spread of disease?
Question Breakdown:
The question focuses on explaining dengue as a mosquito-borne viral disease by identifying its causative agent, describing its mode of transmission, outlining the life cycle of the virus in both humans and mosquitoes, and analyzing how the biological and behavioral characteristics of the Aedes mosquito contribute to the spread of the disease.
Answer:
The question focuses on explaining dengue as a mosquito-borne viral disease by identifying its causative agent, describing its mode of transmission, outlining the life cycle of the virus in both humans and mosquitoes, and analyzing how the biological and behavioral characteristics of the Aedes mosquito contribute to the spread of the disease.
Answer to the Question
Dengue is a mosquito-borne viral disease that poses a major public health challenge in tropical and subtropical regions. It causes dengue fever, dengue hemorrhagic fever, and dengue shock syndrome. The disease spreads rapidly in urban areas due to favorable environmental conditions and the widespread presence of its vector, the Aedes mosquito.
Dengue is caused by the Dengue virus (DENV), which belongs to the genus Flavivirus and the family Flaviviridae. There are four distinct serotypes: DENV-1, DENV-2, DENV-3, and DENV-4. Infection with one serotype provides lifelong immunity against that serotype but not against others, making secondary infections more severe due to immune enhancement.
Dengue virus is transmitted to humans through the bite of an infected female Aedes aegypti or Aedes albopictus mosquito. Transmission occurs when the mosquito feeds on the blood of an infected person during the viremic phase and later transmits the virus to a healthy individual. Dengue does not spread directly from person to person.
The life cycle of the dengue virus involves two hosts: humans and mosquitoes.
- In Humans
After an infected mosquito bite, the virus enters the bloodstream and infects immune cells. It replicates and spreads, causing fever and other symptoms. The virus remains in the blood for several days. - In Mosquitoes
When a mosquito bites an infected human, it ingests the virus. The virus replicates in the mosquito’s gut, spreads to the salivary glands, and becomes ready for transmission after an incubation period of about 8–12 days.
This human-mosquito-human cycle maintains the spread of dengue in populations.
Role of Aedes mosquitoes in Disease Spread
The Aedes mosquito is the primary vector responsible for the transmission of the dengue virus due to its unique biological and behavioral characteristics. It breeds in artificial water containers found in urban environments, bites humans during daytime hours, and shows a strong preference for human hosts. Once the virus enters the mosquito during a blood meal, it multiplies in its body and reaches the salivary glands, enabling the mosquito to transmit dengue to multiple individuals throughout its lifespan. These traits make Aedes mosquitoes highly efficient in sustaining and amplifying dengue outbreaks.
(D) Discuss the role of decision support system in organizational management and strategic planning?
Question Breakdown:
The question requires discussing the role of Decision Support Systems (DSS) in organizational management, highlighting how they assist in data-driven decision-making, problem-solving, and operational efficiency, and evaluating their contribution to strategic planning and long-term organizational goals.
Answer:
A Decision Support System (DSS) is an interactive, computer-based tool that assists managers in making informed decisions by analyzing data, modeling alternatives, and providing actionable insights. DSS combines data, models, and analytical techniques to improve decision quality, reduce uncertainty, and enhance organizational efficiency. In modern management, DSS plays a critical role in both operational decision-making and strategic planning.
Role in Organizational Management
In organizational management, DSS facilitates timely and accurate decision-making by providing relevant information in a user-friendly format. It allows managers to
- Analyze operational data to optimize resource allocation, production schedules, and inventory management.
- Evaluate financial performance through scenario analysis and forecasting.
- Identify trends, patterns, and anomalies that support proactive management decisions.
- Enhance collaboration and communication by integrating data across departments.
For example, a retail company can use DSS to monitor sales patterns, predict stock requirements, and minimize overstock or shortages, improving operational efficiency and customer satisfaction.
Role in Strategic Planning
DSS supports long-term planning and strategic decision-making by evaluating multiple scenarios, risks, and opportunities. Key contributions include:
- Facilitating scenario planning to assess the impact of market changes, policy shifts, or competitive actions.
- Enabling risk analysis to anticipate uncertainties and prepare mitigation strategies.
- Supporting resource allocation by modeling financial, human, and technological investments for optimal returns.
- Assisting in performance measurement and tracking progress toward organizational objectives.
For instance, an energy company can use DSS to decide on investments in renewable energy projects by analyzing cost, potential returns, environmental impact, and regulatory considerations.
Question No. 5
(A) Describe the working principle of cellular networks. How do mobile devices maintain connectivity while moving between cells.
Question Breakdown:
The question requires describing the working principle of cellular networks, including how coverage is divided into cells and signals are transmitted via base stations, and explaining how mobile devices maintain connectivity through handoff mechanisms when moving between cells.
Answer:
Cellular networks are communication systems that divide geographic areas into small regions called cells, each served by a base station. They enable widespread mobile communication by efficiently reusing radio frequencies across different cells. Cellular networks form the backbone of mobile telephony, supporting voice, data, and multimedia services.
Working Principle of Cellular Networks
The working of a cellular network is based on the principle of frequency reuse and cell division.
- Cell Structure: The service area is divided into multiple cells, typically hexagonal for simplicity. Each cell contains a base station with antennas and transceivers.
- Frequency Allocation: Each cell is assigned a specific set of frequencies that are reused in non-adjacent cells to maximize spectrum efficiency.
- Signal Transmission: Mobile devices communicate with the nearest base station using allocated frequencies. The base station connects calls or data to the mobile switching center (MSC), which manages routing and handovers.
- Capacity and Coverage: Smaller cells increase network capacity and coverage, allowing more simultaneous users within the same geographic area.
This structure allows mobile networks to serve large populations efficiently while minimizing interference.
Maintaining Connectivity While Moving Between Cells (Handover)
Mobile devices maintain connectivity while moving through different cells via a process called handover (handoff).
- Signal Monitoring: The mobile device continuously monitors the signal strength of its current cell and neighboring cells.
- Handover Decision: When the signal from a neighboring cell becomes stronger than the current cell, the network initiates a handover.
- Seamless Transition: The call or data session is transferred to the new cell’s base station without interruption, ensuring continuous connectivity.
- Types of Handovers
- Hard Handover: The connection is broken from the current cell before connecting to the next.
- Soft Handover: The mobile connects to the new cell before releasing the old connection, common in 3G and 4G networks for smooth transitions.
Through handover mechanisms, mobile networks support uninterrupted voice calls, video streaming, and data services even while users move at high speeds.
(B) Using the photoelectric effect, explains the particle nature of electromagnetic radiation. How did experimental observations challenge classical wave theory and lead to the development of quantum mechanics?
Question Breakdown:
The question requires explaining how the photoelectric effect demonstrates the particle nature of electromagnetic radiation, highlighting key observations such as the dependence on frequency rather than intensity, and analyzing how these findings challenged classical wave theory, ultimately contributing to the development of quantum mechanics.
Answer:
The photoelectric effect is the emission of electrons from a metal surface when it is exposed to light of sufficient frequency. Classical wave theory of light predicted that increasing the intensity of light should increase the energy of emitted electrons. However, experimental observations contradicted this, revealing the particle-like behavior of electromagnetic radiation and laying the foundation for quantum mechanics.
Photoelectric Effect and Particle Nature of Light
In the photoelectric effect, electrons are emitted only if the incident light exceeds a threshold frequency specific to the metal. Increasing light intensity increases the number of emitted electrons, but not their kinetic energy, which depends solely on the light’s frequency. This observation could not be explained by classical wave theory, which predicted that higher intensity should impart more energy regardless of frequency.
Albert Einstein explained this phenomenon by proposing that light consists of discrete packets of energy called photons, with energy E=hv, where is Planck’s constant and is the light frequency. Each photon transfers its energy to a single electron, and only if exceeds the work function of the metal does the electron get ejected. This clearly demonstrated the particle nature of electromagnetic radiation.
Challenges to Classical Wave Theory
Classical wave theory failed to explain key observations of the photoelectric effect:
- Threshold Frequency: Electrons are emitted above a minimum frequency, regardless of light intensity.
- Instantaneous Emission: Photoelectrons are emitted immediately after light exposure, contradicting the idea that energy gradually accumulates.
- Energy Dependence on Frequency: Electron kinetic energy depends on light frequency, not intensity.
These contradictions highlighted the limitations of classical physics in explaining light-matter interactions.
Impact on Quantum Mechanics
The photoelectric effect provided direct evidence that energy is quantized, leading to the development of quantum mechanics. It supported Planck’s earlier hypothesis of energy quanta in blackbody radiation and inspired further research into wave-particle duality, where electromagnetic radiation exhibits both wave-like and particle-like behavior. This paradigm shifts revolutionized physics, enabling explanations for atomic spectra, electron behavior, and fundamental principles of modern physics.
(C) List the major social media platforms used for business and communication. How do they contribute to digital marketing? Explain.
Question Breakdown:
The question requires listing major social media platforms used for business and communication, such as Facebook, Instagram, LinkedIn, Twitter, and TikTok, and explaining how they contribute to digital marketing through brand promotion, customer engagement, targeted advertising, and analytics-driven decision-making.
Answer:
Social media platforms are digital tools that allow individuals and organizations to create, share, and interact with content online. In the modern business environment, social media has become essential for communication, brand promotion, and customer engagement. They also play a crucial role in digital marketing, enabling companies to reach wider audiences efficiently and cost-effectively.
Major Social Media Platforms
- Facebook: Widely used for brand promotion, targeted advertising, and customer engagement through posts, videos, and paid campaigns.
- Instagram: Visual-centric platform for sharing images and short videos, ideal for lifestyle, fashion, and product marketing.
- Twitter/X: Enables real-time communication, brand updates, customer service, and viral marketing campaigns.
- LinkedIn: Professional networking platform used for B2B marketing, recruitment, and thought leadership.
- YouTube: Video-sharing platform for tutorials, advertisements, brand storytelling, and influencer marketing.
- TikTok: Short-form video platform increasingly used for viral marketing, product promotion, and engaging younger audiences.
- WhatsApp/Telegram: Messaging apps used for direct customer communication, promotional campaigns, and customer support.
Contribution to Digital Marketing
Social media platforms contribute to digital marketing in several ways:
- Brand Awareness: Companies can reach global audiences through posts, stories, ads, and viral campaigns, building recognition and loyalty.
- Targeted Advertising: Platforms offer demographic, geographic, and interest-based targeting, ensuring marketing messages reach the right audience.
- Customer Engagement: Businesses can interact directly with customers, receive feedback, answer queries, and build relationships.
- Content Marketing: Platforms allow sharing of videos, blogs, infographics, and other content that informs and attracts potential customers.
- Data Analytics: Social media provides insights into customer behavior, campaign performance, and market trends, helping businesses refine strategies.
- Cost-Effective Marketing: Compared to traditional advertising, social media campaigns are more affordable, measurable, and scalable.
In today’s digital economy, social media is indispensable for reaching audiences, building customer relationships, and driving business growth.
(D) Explain the GPS system determines the positions of a receiver using satellite?
Question Breakdown:
The question requires explaining how the GPS system determines the position of a receiver by using signals from multiple satellites, including concepts like trilateration, time delay measurement, and the role of satellite constellations in providing accurate location data.
Answer:
The Global Positioning System (GPS) is a satellite-based navigation system that provides location, velocity, and time information to users anywhere on or near the Earth. GPS works continuously, in any weather, and without the need for a network connection. It relies on a constellation of satellites, ground stations, and GPS receivers to accurately determine positions.
Working Principle of GPS Positioning
GPS positioning is based on the principle of trilateration, which uses the known positions of satellites and the distance between the satellites and the receiver to determine the receiver’s location.
1-Satellite Signals
Each GPS satellite continuously broadcasts signals containing the satellite’s position and precise time.
2-Distance Measurement (Pseudo range)
The GPS receiver calculates the distance to each satellite by measuring the time delay between signal transmission and reception. The distance is given by:

3-Trilateration
- Using signals from at least three satellites, the receiver determines its 2D position (latitude and longitude) by intersecting three spheres.
- With four or more satellites, the receiver also calculates altitude and corrects clock errors, giving a precise 3D position.
4-Error Correction
GPS accounts for signal delays caused by the atmosphere (ionosphere and troposphere) and uses error-correction signals from ground control stations to improve accuracy.
Key Components of GPS
- Space Segment: A constellation of 24+ satellites orbiting the Earth, transmitting signals continuously.
- Control Segment: Ground stations that monitor satellite positions, maintain clock accuracy, and upload navigational data.
- User Segment: GPS receivers that capture satellite signals and calculate position, velocity, and time.
GPS determines the position of a receiver by measuring the distance from multiple satellites using signal travel time and applying trilateration. With at least four satellites, GPS provides accurate 3D positioning, enabling navigation, mapping, and timing services worldwide. Its reliability, accuracy, and global coverage make it indispensable for modern transportation, communication, and strategic applications.
SECTION-II
The remaining part of the CSS General Science and Ability paper 2025 is being solved by Miss Iqra Ali and Sir Ammar Hashmi. Keep visiting the page to get the complete solution.

CSS Solved Past Papers’ Essays
Looking for the last ten years of CSS and PMS Solved Essays and want to know how Sir Kazim’s students write and score the highest marks in the essays’ papers? Then, click on the CSS Solved Essays to start reading them.
CSS Solved Essays